Debugging
Python/Flask
Python debugger
For debugging use the Python debugger (PDB) or one of the variations (ipdb, pytest and wdb).
To set a breakpoint place the following code:
breakpoint()
Flask DebugToolbar
You can also install Flask-DebugToolbar:
cd ~/src/my-site
pipenv run pip install Flask-Debugtoolbar
It has built-in:
- Profiler
- SQL queries logging
- View config/templates
SQL queries
Last, but not least you can print SQL queries to the console by setting the SQLALCHEMY_ECHO variable in your config.py:
# config.py
SQLALCHEMY_ECHO = True
Logging output
If you need to debug some code in a deployed environment (hard to debug locally), you can print the logs to the standard output or to a file. To see the logs in the terminal (e.g. in a container log), you can do the following:
- prepare your code with the necessary logging instructions:
from flask import current_app ... current_app.logger.info(f"my variable: {my_variable}") - make sure that the log level of Flask is at least the same as your log instructions, in this case
info. This is needed because Flask does not set a log level when running in non-DEBUG mode:def my_func(): import logging current_app.logger.setLevel(logging.INFO) current_app.logger.root.setLevel(logging.INFO) current_app.logger.handlers[0].setLevel(logging.INFO) # handlers[0] is normally the stdout handler ... - deploy and run: you should now see all your logs.
You can customize this, for example, with a file handler. Refer to the Python documentation for more information.
JavaScript
All modern browsers have a built-in JavaScript debugger. You can enable the debugger in your browser and take advantage of the below 2 main ways to debug your JS application:
- Use the
debuggerstatement in your code. - Use the
console.log().
Debugger
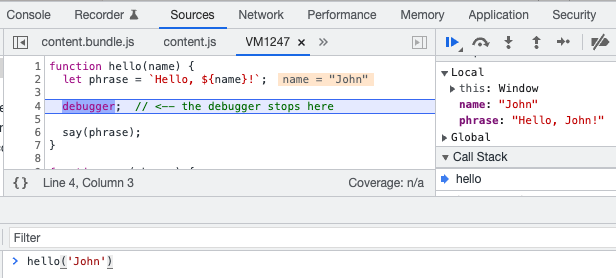
You can add the debugger statement wherever you want to stop the execution of the application code. You can do that by following the next steps:
- Add the statement in your code e.g.,
function hello(name) {
  let phrase = `Hello, ${name}!`;

  debugger;  // <-- the debugger stops here

  say(phrase);
}

function say(phrase) {
  alert(`** ${phrase} **`);
}
- Refresh the page.
- The application execution will stop in the place that you have put the
debuggerstatement. You can think of it as a breakpoint to your source code.
Note: You can test the functionality above by copy/paste the code in your browser's console tab and run the hello function. You should see an output similar to:
console.log()
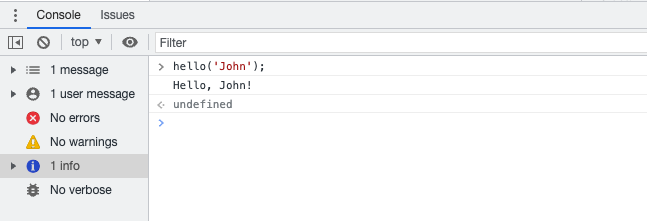
Another powerful tool you have to debug your application is the console.log() function. You can think of it as something similar to Python's print() function but instead of printing in your terminal, it shows the output in your browser's console.
To use the command you can follow the next steps: - Add the statement in your code e.g.,
function hello(name) {
  let phrase = `Hello, ${name}!`;

  console.log(phrase);  // <-- the phrase value will be logged in your browser's console

  say(phrase);
}

function say(phrase) {
  alert(`** ${phrase} **`);
}
- Go to your browser and open the debugger console.
- Check the output of your log command: