Deployment
This guide is meant to give a high-level overview of deployment techniques and tips when planning how to deploy InvenioRDM.
Read the infrastructure architecture first!
This section assumes you have a good understanding of the different services that are needed to run an InvenioRDM application, and how they interact with each other. This information can be found in the infrastructure architecture.
Deployment models
There is no one-size-fits all deployment strategy for InvenioRDM. Therefore, it is hard to recommend how to deploy. Moreover, there are many aspects to take into account: your knowledge in DevOps/Platform engineering, your organization's infrastructure, resources, constraints or policies, the technology you want to invest in and maintain, pricing, etc.
The mentioned technologies are just examples
Along this chapter many technologies will be named. However, note that those are mere examples based on our experience at CERN or from some of the InvenioRDM partners, with all certainty there are many other alternatives for each case.
Two popular deployment models are:
-
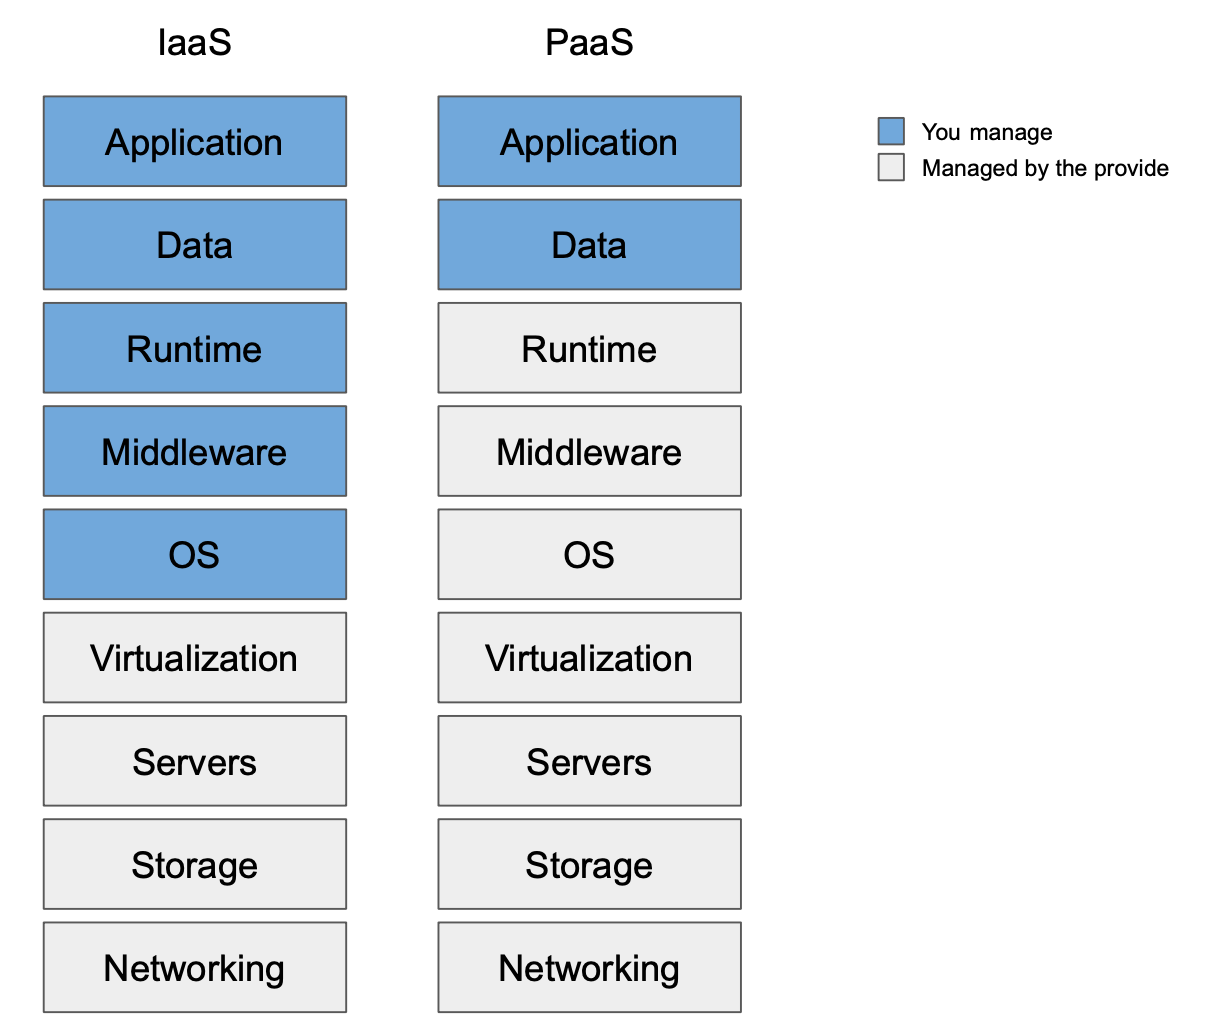
Platform as a Service (PaaS): using this model you will be in charge of the application and the data it handles. This more commonly known as containers, meaning that you will be in charge of packaging your instance's InvenioRDM application in a container image. For example, using the
Dockerfilethat is created when you bootstrapped your instance. At CERN we deploy our instances on OpenShift using the Invenio Helm Charts. These charts help you to deploy your instance on top of Kubernetes clusters too. If maintaining the actual PaaS technology is not something you desire, you can make use of cloud providers such as Amazon Web Services, Google Cloud, Microsoft Azure. -
Infrastructure as a Service (IaaS): using this model you will be in charge of the stack from the operative system up. This is more commonly known as virtual machines, meaning that you will be in charge of configuring the operative system, Python, the web server, etc. At CERN we have been running Invenio v3 instances using OpenStack to manage the VMs, and Puppet for IaC (Infrastructure as Code). Other common IaC technologies are Ansible and Terraform.
You could also keep going down in the layers to get more and more control of your deployment, for example, using bare metal machines. However, that is out of the scope of this documentation.
Docker compose is not recommended
The provided docker-compose files in InvenioRDM can give you a good idea of what you need to deploy, including the underlying services.
However, such configuration is NOT meant to be used in production as-is: it requires knowledge and experience on how to run it reliably, safely stores files with backups, managing software and infrastructure upgrades, understand potential performance limitations (a single machine probably might not handle all your traffic and it would be a single point of failure), etc.
Use at your own risk.
Services
When deploying InvenioRDM, you can choose to install, securely configure and maintain yourself the services (such as the database, the search engine, etc.) services, or use third party providers. For example, the three cloud providers mentioned above (AWS, GC, and Azure) can provide most of the services. If you choose to deploy them yourself you will need to deep-dive and get experienced in the following topics:
- Persist your data, and enable periodic backups. This includes the relational database, the search indices and the files.
- Queue persistence (RabbitMQ) to avoid losing tasks in case the service fails.
- High availability, many of the services can be deployed redundantly. Note that most of the cloud providers offer this option or have an established SLA.
- Secrets handling. Most of the services require credentials to connect. It is a good practice to keep them in a secure place, for example Ansible Vault.
- Security. This is a broad topic, and one of the most important. It is also highly dependent on your deployment model. Take into account exposing only the minimal amount of services needed and safeguard the access to your infrastructure.
If you choose to deploy them using PaaS, images for the services can be found for example in DockerHub. For more information on how to deploy each service, refer to their official documentation.
InvenioRDM Python app
Independently of your deployment model choice, you will need to run the Flask Python application. However, the server bundled with Flask is not meant for production usage, it is there only to help with the development. Therefore, you will need some sort of WSGI HTTP server. Common choices are Gunicorn and uWSGI.
The latter, is the one we use at CERN and it is bundled in the Dockerfile. You can find more information in the InvenioRDM Docker images section.
Versioning
During the lifetime of your project or service, you will develop new features specific to your instance or need to upgrade to a newer version of InvenioRDM. This means that your application code will change and versioning will help you to control which code is actually deployed. At CERN, we use GitHub tags/release for each version (e.g. v1.0.0).
If you are using containers for the deployment, you can automate the image
build with for example GitHub actions
(or any other CI tool). In addition, some PaaS platforms have the capabilities
to detect when a new image for a certain tag (e.g. production) has changed
and re-deploy it automatically.
Monitoring
After your application is deployed and running, monitoring it at many levels will provide you the observability needed to be aware of what is happening in your infrastructure.
Once you have configured where the different services output their logs, they can be aggregated and used to create dashboards for visualization, for example in Loki or OpenSearch Dashboards.
In a IaaS deployments, it might be useful to aggregate also the system logs to monitor the resources consumption. This metrics can be aggregated using Prometheus and visualized in Grafana.
In some cases it is possible to have application specific monitoring. For example, using Flower to monitor the InvenioRDM asynchronous workers. Many of these can also be plugged in to Prometheus.
In an IaaS deployment, independently of the monitoring and logs aggregation tool of your choice, it is a good practice to store the logs in the servers using log rotation.
Alerting
Once the monitoring is in place, the next step is getting alerts for code exceptions and when certain metrics reach a configured threshold.
For the InvenioRDM Python application, Sentry provides a great level of details (variables' values, stacktraces, etc.) when exceptions happen: this is extremely helpful when it comes to understanding errors that happen in production. If you have to invest in one alerting tool, we really recommend this one!
In the Grafana ecosystem, OnCall. Alternatively, many messaging apps can be configured with webhooks to Grafana.
Security
To secure your instance, make sure that:
- You have correctly configured your InvenioRDM instance.
- You have valid HTTPS certificates.
- Your instance and services are up-to-date.
-
Secure file uploads: we should be really careful with what we allow users to upload in our instances, since we are serving them back and they could contain malicious code. Some effective methods to avoid these vulnerabilities are:
- White listing MIMETypes, for example here
- Sanitizing MIMETypes so they do not get executed on the browser, for example sanitizing HTML files to plain text.
- Serve your files from a different domain with a static server where there are no sessions or anything to be compromised.
This list is not meant to be exhaustive: please refer to well-known literature and best practices on how to make your infrastructure secure.
Load testing
It might be interesting to understand what is the load that your system will sustain, to size your infrastructure accordingly. That can be tested for example with locust or k6.
Troubleshooting
The first step to troubleshooting a problem would be to try to understand in which layer or service of the system is the problem. That can be checked using the monitoring and dashboard technologies mentioned above, or the log files directly.
If the problem is in the InvenioRDM Python application, you can get more details in Sentry. Afterwards, you can try to reproduce it and debug in a local installation.
For more information see the how to debug section.